
This article is written by Jessica Lachs, DoorDash’s VP of Analytics & Data Science, where she’s built out the team since joining as a General Manager back in 2014.
“Data-driven” is often tossed around as an aspirational buzzword. No matter your industry, you’ve likely felt the pressure to have a sturdy numbers-crunching operation. But what “being data-driven” actually means when it comes to structuring an analytics team — from fledgling startups to later-stage companies — can be a bit of a mystery.
I’ve had a front-row seat to DoorDash’s growth for the last ten years, joining as the first General Manager back in 2014 and then building the analytics team from the ground up. As the company’s VP of Analytics & Data Science today, I head up the global org that helps us use data to make better decisions. More recently, I’ve expanded my role to lead the Wolt Analytics team and share best practices globally after a 2021 acquisition to supercharge DoorDash’s international growth.
I know that devising an analytics function is no easy task for founders. Outside of my full-time role at DoorDash, I’m also an advisor and angel investor, working with early-stage founders who are just starting to stand up critical functions within their companies. What I’ve seen is that analytics is something of a gray zone. The case for engineering or sales teams is clear — I need to build X product, I need to sell X product — but it’s less clear what kind of impact an analytics team can deliver.
Many founders I speak with want to build a data-driven organization but don’t know what they need and when to get started. I’m often asked the following questions:
- What is analytics, and what does a best-in-class analytics function look like?
- When is the right time to invest in an analytics function?
- Who are the right folks to hire for the team?
Here, I’ve laid out my playbook for scaling an analytics org from 0 to 1. I unpack what analytics actually means and discuss what to expect from an analytics team, including a stage-by-stage breakdown of how to structure an analytics org, specific hiring profiles, and a helpful checklist to assess your startup’s readiness for an analytics team. This detailed case study, replete with firsthand examples from DoorDash, can help founders figure out what they want from analytics and lay the groundwork for an organization that can grow with their startup.
ANALYTICS 101: FIGURING OUT THE “WHAT” FOR YOUR ORGANIZATION
Focus on your needs, not nomenclature
The ambiguity of the term “analytics” can create confusion. Is analytics different from data science? Business intelligence? Product analytics? Machine learning? BizOps? The answers will differ depending on who you ask — it varies from company to company.
Instead of questioning the semantics, decide on the outcomes you want first.
Generally speaking, the analytics team's role is a function of a company's data-centricity. Some companies don’t prioritize data in decision-making, perhaps because they don’t have reliable data yet at their size or stage — or because leaders’ past experience with analytics was limited to business reporting. Other companies, like DoorDash, prioritize the use of data in decision-making, giving analytics a broader remit and a seat at every table where a business decision is being made.
But even within the same company, the role of analytics can change over time as the business matures — as it did at DoorDash. When a company is in its early stages, there’s less data to analyze, and decisions are often more straightforward. Making decisions by gut instinct can lead to good outcomes for some time, but it doesn’t scale.
In the early days of DoorDash, we didn’t need a data science team because we didn’t have a lot of data. Most of our analysis used quasi-experimental methods, which relied on comparing like-markets to measure meaningful changes in key metrics (like difference-in-difference, for example). Over time, the problems got more complex and answers required higher precision. We recognized that we needed to improve our data collection, build scalable and accessible data models, and invest in our experimentation capabilities to advance our analytics. So we expanded the scope of analytics to incorporate new disciplines to address these projects.
The teams you need will change based on the types of problems you have, the amount of data you have, and how you plan to use data for decision-making.
The three C’s of an analytics function
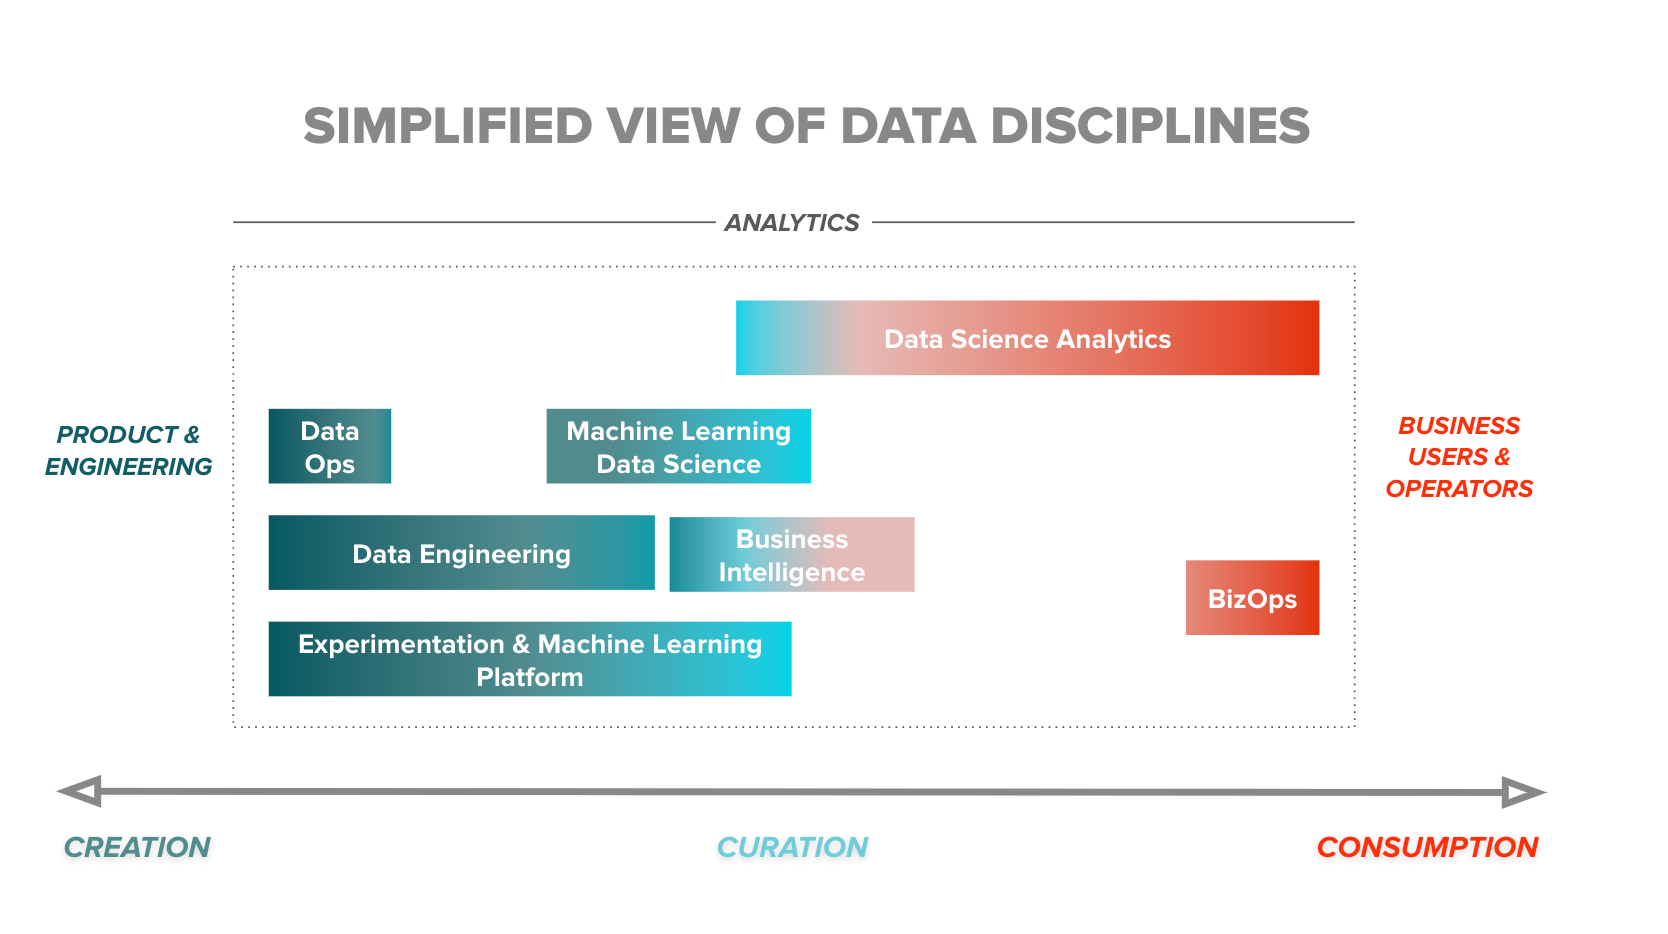
There are three core elements of analytics: creating the data you need, curating that data for usability, and helping users accurately interpret and consume that data to make decisions.
Analytics sits on the spectrum of data creation, curation, and consumption.
Data creation
Before making decisions with data, you need to have data to use. Having reliable data is the foundation of any analytics org. There are many types of data, but at DoorDash, we focused on two types:
- 1. Transactional data: Purchases and related attributes, including time, location, price, payment method, and discounts of that purchase
- 2. Behavioral data: What the user does in the mobile or web app (this is what we call telemetry)
These are some other types of data you might create or collect (which are by no means exhaustive):
- Demographic or psychographic data
- System data
- Data from your CRM and other third-party tools or services
Engineering typically owns data creation, but analytics can play an important role in outlining what kind of data you need and how it should be structured. This can include identifying which elements of a page or process you should log, scoping what information is required to contextualize this new data in the broader data ecosystem, and standardizing column formats and naming conventions for usability. For example, you want iOS event naming conventions consistent with Android and web.
The DoorDash analytics team spent substantial time on data creation in the early days, primarily out of necessity rather than intentional design. We often found, munged, and manipulated the data ourselves. If we found gaps in data collection, we worked with our engineering counterparts to fill them.
For example, in the early days of DoorDash, we wanted to understand how consumers were using the DoorDash app. So we mapped out every step of our ordering process — from when a user opens the app to when a user receives an order —and identified which elements we were tracking and where we had gaps.
We found a lot: missing logs of consumer actions (e.g., a page view), inconsistencies in logging across platforms (e.g., iOS data formats and column names were different from Android), and missing "metadata" (e.g., descriptive information about a page view was absent). This logging set the foundation for many consumer-app product improvements over the years.
Data curation
Data curation is developing and maintaining data models to democratize data through easy access and use. This includes data munging, which is the process of cleaning, parsing, and validating data before it’s ready to be used.
Early at DoorDash, queries were slow to run and dashboards frequently timed out. This wasn’t surprising because getting an output required complicated underlying SQL code across many data tables. This became a blocker to the analytics team’s productivity, and it became necessary to build our first data models to unblock foundational analyses around purchase behavior, unit economics, and logistics efficiency.
We weren’t experts in data modeling, so this was a temporary solution until we could hire folks with a data engineering (DE) background. We started with two folks who could refactor our existing code to speed things up in the short term while beginning to think about our long-term data needs. Over time, we built the DE team from two to more than 30 data engineers before moving the team over to the broader engineering organization.
Data consumption
This brings us to the third data discipline on the data continuum: data consumption. While the analytics function at DoorDash has evolved since its origin in 2015, the mission hasn’t changed: to continually improve the business through scientific and data-driven insights.
With the existing data in an accessible form, ready for consumption, there’s a lot the analytics team can do to understand the key business levers, identify opportunities to improve the business, and measure the impact of the product or business decisions.
For example, at DoorDash, we believed that speed was important to consumers. We had robust data on how long a delivery took — from when a consumer placed the order to when it was delivered (and all the steps in between).
But initially, we didn’t record the data of the delivery time estimates shown to consumers on the homepage, which we called “ETAs." The only measure of speed we had was after someone placed an order. We didn’t have visibility into what consumers saw when they opened the app and what would inform their perception of speed on our platform.
So we added logging for homepage ETAs and built a data model to make the data accessible. As a result, we identified an opportunity to increase the accuracy of our ETAs, improving the consumer experience and driving meaningful growth.
A solid data foundation doesn’t just benefit the analytics team — lots of other teams across an organization can get something out of it. They can consume data on their own through dashboards and self-serve visualization tools, empowering decision-makers without total reliance on the analytics team for insights.
Structuring data consumption at each stage of a startup
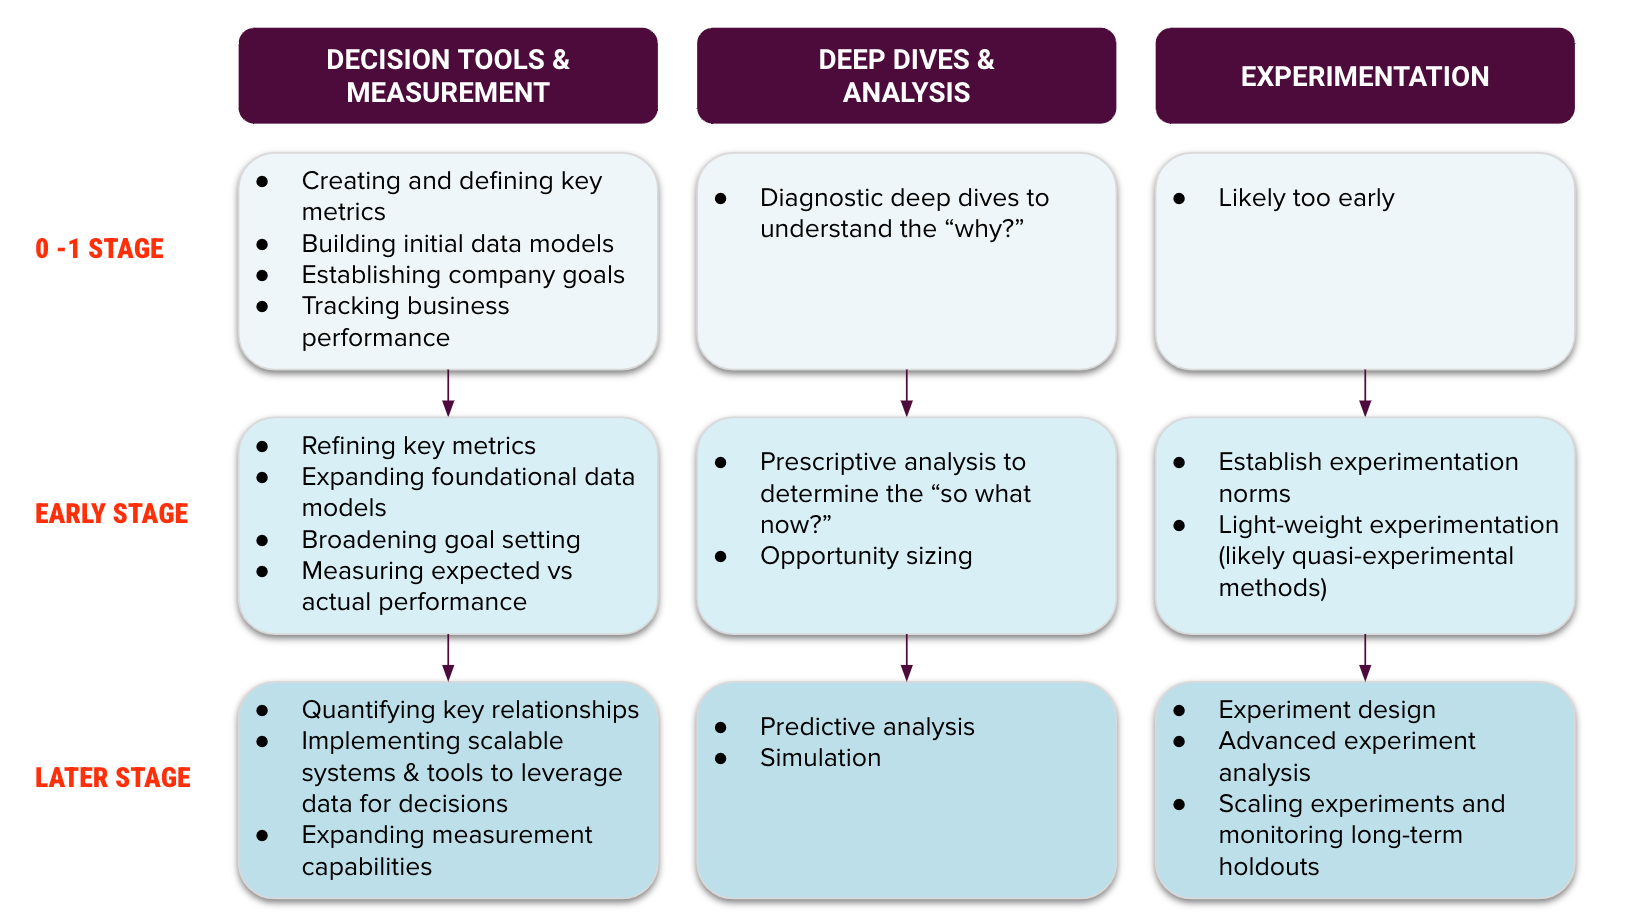
Let’s dig deeper into the analytics function and how data consumption translates into business impact at different company stages. There are three focus areas:
- 1. Decision tools and measurement: Defining key metrics, providing access to these metrics, setting goals, and measuring business performance
- 2. Deep dives and analysis: Understanding the foundational relationships core to your business and identifying opportunities to improve
- 3. Experimentation: Measuring the incremental impact of product features and business decisions to inform future iterations
The level of complexity and sophistication in each area will change as a company matures. Here’s a framework I use to break this down for founders curious about what analytics might look like at the different stages.
The 0 - 1 stage: < 100 people, Seed or Series A
At this stage, analytics should focus on defining and tracking the core metrics to measure product-market fit.
Ask yourself what you need to accomplish in the next quarter, by next year, or before the next fundraising round — and make sure you’re measuring those things.
Tracking the right metrics and setting the right goals will objectively tell you how your company is doing. These numbers are a feedback loop to tell you if your actions are working and will let you course-correct sooner.
I could write an entire post on how to land on the right metrics for your business. But it boils down to this: In the initial stages of a company, you should generally focus on user acquisition, customer engagement, revenue generation, and operational efficiency.
For DoorDash in the early days, we tracked these metrics:
- Order volume
- New consumer acquisition
- Consumer cohort retention
- Number of merchant partners
- Actual delivery times
- Percent of late orders
- Deliveries per hour on delivery
- Star ratings
- Constraint metric of unit economics
To track these metrics, you’ll need to agree on how you define them and build initial data models to support accurate calculations and easy access. Then you can set goals against these metrics.
As you start tracking your business performance and progress against goals, you’ll have questions about the trends you’re seeing. This will initiate diagnostic analyses into what’s driving beats and misses and deep dives to understand the drivers of your metrics. For example, maybe you’re missing your new consumer acquisition goal. In that case, you’ll want to look at your spending levels, channel performance, onboarding and activation, and the new consumer experience to understand what’s causing the softness.
While some startups might want to start experimenting early, I caution most to hold off. At these early stages, you typically have small sample sizes, and the decisions you’re making should have a “see it from space” impact where a simple difference-in-difference could suffice to measure the effect if needed. If you require precise measurement at this early stage, I’d question whether you’re shipping impactful enough features. If you’re trying to 10x the business, you probably won’t get there with micro-optimizations.
Most 0-1 stage companies will get more out of measuring key metrics and understanding the drivers of these metrics than investing in experimentation.
Early-stage companies: 100 - 400 people, Series B or C
Startups in this stage will hit an inflection point where they’ll need to decide what kind of analytics function they want. There are two paths: analytics as a measurement function or a team that uses data to drive business impact.
Unsurprisingly, I believe the second path is the better option and will accelerate your startup’s trajectory.
To do this, you have to double down on the foundation you’ve already set up:
- Refine your key metrics as you’ve learned more about the input drivers
- Expand foundational data models to incorporate more metrics and business lines
- Broaden goal setting beyond top-line goals to set input goals for various business units
- Start to measure expected performance versus actual performance, incorporating current course and speed with incremental impact
At this point, you’ll have more data and better understand your business’s drivers. This will make your forecasts more accurate and advance your ability to quantify the impact of your actions.
You’ll get the most leverage by empowering the analytics team to do prescriptive analysis and recommend actions based on what they’ve uncovered. The expectation should be recommendations that will change or inform a critical decision, not research. The goal is to find insights that drive the business forward.
An early example from DoorDash is the origin of our selection intelligence platform. Superior restaurant selection was always a crucial part of DoorDash’s early strategy. Initially, we measured the number of merchants, but after a deep dive into the relationship between number of merchants and conversion, we discovered two important things:
- 1. While merchant count strongly correlated with conversion, there was a clear step function change at around 100 merchants. This threshold depended on city size, among other factors. Still, this insight led to developing minimum selection thresholds and focusing on getting more of our cities over the minimum selection thresholds.
- 2. We saw a wide variance in merchant-level conversion rates when studying the outliers. High-converting merchants could bring up overall city-level conversion, even if the city had a below-average merchant count. This led to the insight that some merchants are more valuable to the marketplace than others. Adding a popular pizza restaurant was more impactful than adding an average pizza restaurant, and adding the first Thai restaurant had a more significant impact on consumer engagement than adding the 12th Thai restaurant for the same subset of consumers. From there, we built a selection intelligence platform that scored merchants based on several inputs to improve consumer selection and maximize growth. The new scoring system changed how we measured selection health, prioritized our lead lists, and compensated our sales team.
In addition to prescriptive analytics, the analytics team should help business partners across the company — like product, engineering, and operations — size new opportunities and prioritize those opportunities against alternatives. The planning process is an integral part of a company’s development, and investing in a data-driven process from the onset will make it easier to work through complex tradeoffs and make sure the team prioritizes the most impactful initiatives.
Finally, at this early stage, it’s important to get alignment across the company on what the experimentation culture will look like. As a rule, I advocate for measuring everything you can, but this may not be the right approach for all companies. Openly aligning with company leadership on experimentation norms is a critical first step, including when and when not to experiment, how to incorporate experimentation into product and business decisions and whether you intend to build or buy your experimentation platform.
Ask yourself if you’re willing to change decisions based on the outcomes of experiments. If you’re not, building an experiment culture may not be the best use of your resources. Experiments shouldn’t support confirmation biases and be ignored when they present you with contradictory evidence.
Later-stage companies: > 400 people, Series D or post-IPO
Companies that want to use data to drive business impact will have to balance the need for immediate access to data to inform decision-making with the investment in the long-term scalability of the data and analytics platform. A great analytics leader can walk this fine line, unblocking partner teams with access to data and insights, while building the processes and tools to empower the analytics team in the future.
At this later stage, analyses and experimentation become more complex and sophisticated. The team’s scope may also expand to support additional business units.
In addition to diagnostic and prescriptive analytics, the team may use predictive analytics to better understand likely outcomes and simulation to model the impact of a particular recommendation. The most significant advancement will likely come from more developed experimentation to better quantify the impact of initiatives and inform the next product iteration. Experimentation-supported product development will require the analytics team to run exponentially more experiments in less time, requiring new methodologies and experimentation techniques to be employed.
What does the perfect end-state look like? I can’t answer this yet — but I can share how the analytics team at DoorDash and Wolt does it today:
Decision tools and measurement, such as:
- Creating and defining key metrics
- Building foundational data models to ensure accuracy and access to data (such as defining sales and establishing app telemetry for funnel analysis)
- Quantifying key relationships to facilitate prioritization and estimate the impact of future initiatives (such as restaurant selection to volume, delivery density to cost)
- Implementing scalable systems and tools to use data for decisions (such as pricing intelligence)
- Establishing company goals to drive accountability and alignment
- Measuring expected vs. actual impact to make sure we’re on track to hit goals
Deep dives and analysis, such as:
- Diagnostic analysis to figure out why something may have happened or to understand what drives metrics (such as trend breaks or monthly active user inputs)
- Prescriptive analysis to determine “what should be done” to improve our key metrics (for example, what are the right new user programs to increase engagement of new consumers?)
- Opportunity sizing to help understand the impact of different initiatives and prioritize our largest levers (for example, what’s the expected effect of requiring phone verification for new users? How does that compare to other projects that improve delivery quality?)
- Predictive analysis to determine the next best action or most likely outcome (for example, which factors predict merchant churn?)
- Simulation to understand the impact of changes on our key metrics (for example, how much volume do we expect for a delivery time that’s one minute shorter?)
Experimentation, such as:
- Experimentation norms, including when or when not to experiment, how to incorporate experimentation into product and business decisions, and build vs. buy decisions
- Experiment design to ensure we’re able to get the learnings we want based on our key metrics, such as A/B tests vs. switchback vs. difference-in-difference, sample size calculations, build/buy experimentation platform
- Experiment or quasi-experiment analysis to determine the impact of our initiatives on key business metrics, including causal inference when randomized experimentation isn’t possible
- Experiment deep dives to determine why a product did or didn’t work and inform the next iteration or product
- Scaling experiments and monitoring long-term holdouts to ensure we keep iterating on learnings and continue driving impact
The breadth of the team’s reach has changed over the years — and the depth of our analysis has grown — but our goal to drive business impact has remained constant.
Building this kind of analytics team hinges on choosing a handful of folks to start the org, so let’s get into finding the right people for your early team.

HIRING FOR ANALYTICS: FINDING THE RIGHT “WHO” FOR YOUR EARLY TEAM
Because the role of analytics in the early stages is so broad, I recommend starting with generalists for the earliest hires.
For most early-stage companies, you don’t need someone with deep expertise in machine learning or data engineering or a PhD in statistics. While there are exceptions, of course — AI startups, for example, might require early expertise — if you’re looking for someone to tackle foundational analytics problems discussed above, then a generalist will be your best bet. The kind of folks I recommend hiring at an early stage are “no-regrets” hires.
A great generalist can take on most challenges you throw at them — and startups are never short of challenges. Some of our early team members at DoorDash went on to join the product team, the finance team, and the operations team, while most acquired more advanced technical skills on the job and continued to work on increasingly complex analytics problems as the company scaled.
Even if analytics advances beyond a generalist’s interest or existing skill set, a knock-on benefit of hiring intelligent, capable, and curious people is that they’ll be valuable on any team.
Hard and soft skills to look for
Here are the skills I assess candidates for when hiring for a generalist:
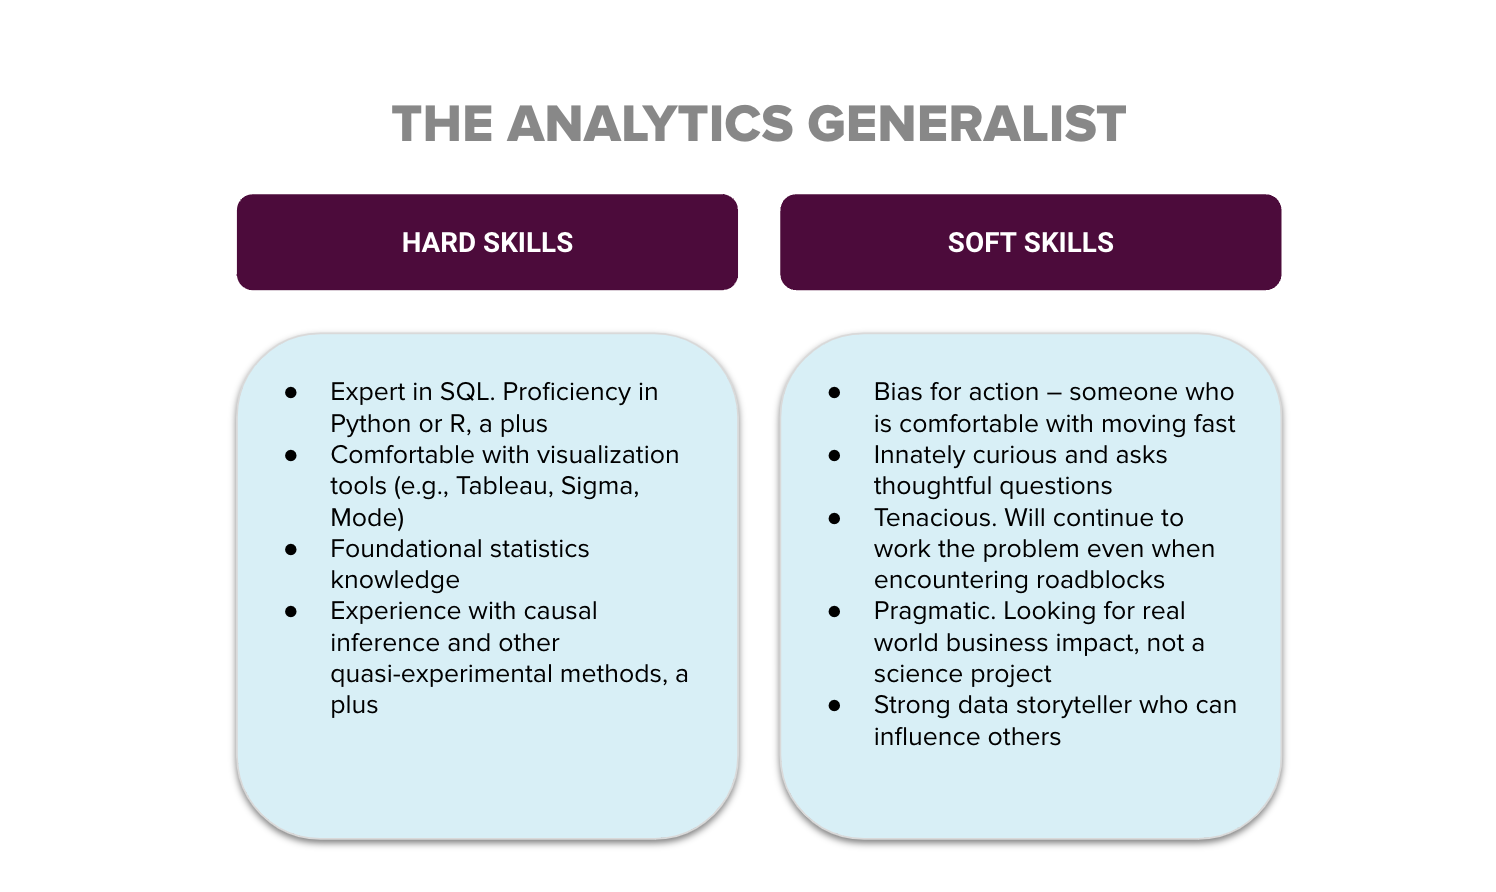
Hard skills
- They have the technical skills to pull and manipulate the data. Focus on technical proficiency rather than deep technical expertise — for example, you don’t need someone who specializes in building ML models in production.
- SQL proficiency is required. Additional programming languages like Python or R are a bonus. You don’t want your initial hires to have to ping engineers every time they need data because they can only work in Excel. For an early-stage analytics hire, the ability to independently access, clean, and manipulate data is critical.
- Basic knowledge of statistics concepts to avoid common analysis pitfalls, like correlation vs. causation, multicollinearity, and skew.
Soft skills
- They’re a pragmatic problem solver. You want someone who can drive real-world business impact, not someone who acts like they’re conducting laboratory research.
- They have a strong bias for action and are comfortable making decisions quickly. Speed can be a competitive advantage.
- They’re highly curious. Curiosity can’t be taught, so look for someone who asks many questions.
- They’re a relentless truth seeker. You want someone who won’t give up because they encounter an obstacle, but will find a way to solve the problem.
- They’re a strong communicator who can tell a story with data to influence decisions.
Technical skills are essential but can be learned on the job. I recommend holding a hard line on the soft skills, some of which can’t be taught, and being more flexible on the hard skills for your initial hires. I would also look for folks who complement one another — pair someone technically stronger with someone who has business acumen so they can learn from each other.
The superpower of a great generalist is the ability and motivation to do what’s necessary to solve the problem. If they don’t know Python but need to write a Python script to access a particular data source, they’ll figure out how.
There will always be more questions than the capacity to answer, so it's essential to have a generalist who can jump in and own the entire problem. Equally important is having someone who knows which questions to prioritize and which to deprioritize on behalf of the business.
Hire internally if you can
But it won’t always be necessary to hire externally for this team. Depending on the complexity of the problems, someone from an internal team may be able to fill the role — just as I was.
Startups are an excellent place for smart folks to take on new challenges they wouldn’t necessarily be hired for in a more mature company. At DoorDash, I was the founding member of analytics. I moved into the role after my initial role launching and leading new cities as a General Manager (the company’s first). I often advise that an internal transfer is a great way to get things started, capitalizing on the strengths and knowledge of folks who already understand the business. Because this was my path, I always looked for internal mobility opportunities for my team members.
Look first at finance and operations folks with a natural curiosity and the requisite SQL skills. If you don’t have anyone who’s the right fit internally, then look externally to hire.
Pick mid-level ICs early on
For an early hire, you want to find someone who knows how to do the work and is excited to get their hands dirty. For this reason, I recommend hiring a mid-level independent contributor (IC) — someone who’s independent enough to build their own roadmap but doesn’t consider themselves too senior to be doing IC-level work. The more senior and later stage you go, the more difficult it becomes to find someone who will roll up their sleeves and do the work.
You’re looking for someone who can ask questions — better than you can — and not simply answer your questions. A mid-level IC hired for your analytics team should be confident enough in their work and point of view to speak truth to power. If you’re wrong, you want to know you’re wrong, and be able to trust that you’re actually wrong.
Add specialists as you grow
As your analytics organization matures, you may find that you need to expand your hiring to include more specialists, either to fill skill gaps or to solve specific problems.
At DoorDash, our first five analytics folks were generalists. Then we realized we needed someone with a machine learning background to solve some of our Dasher and logistics analytics problems. Predictive modeling was a gap in the team's skillset, so we hired our first machine-learning data scientist to fill it. We maintained our soft skills hiring guidelines to ensure that even a specialist fit into our team’s way of doing things.
My approach was to hire folks to cover problem areas that aligned with how our product, engineering, and operations teams were structured. For example, Dasher analytics partnered with the Dasher engineering team, Dasher product managers and Dasher operators. This end-to-end ownership kept the analytics team lean and allowed the cross-functional team to work together to prioritize the analyses that would be most helpful for everyone to hit their shared goals.
This model worked well with the team's generalists, and we could selectively add specialists as needed. Among our first 20 analytics hires, we hired four machine learning data scientists, three data engineers and a data product manager. This team carried us through our Series D.
Sample profiles of early analytics hires
Top talent can come from all places and backgrounds. But here are some profiles that I have had success hiring over the years:
- Analytics folks from a similar industry are an obvious choice, but be careful. Make sure they’re really top talent and understand why they’re leaving their current role. Would they be happy at your company if they weren’t happy in a similar role? This profile is one of the hardest to interview since their highly relevant experience gives them an advantage in the interview process. I hold a very high bar when hiring from this group.
- Undergraduate degrees in mathematics or computer science coupled with a job in a business function in a client-facing role. This was the profile of my first hire — he was a great mix of engineer and salesman. Both technical and non-technical business partners loved working with him, and he possessed the technical skills to make sense of our messy data.
- Consultants with technical backgrounds. One of my most commonly hired profiles is the “technical consultant,” often a structured problem solver and strong communicator.
- Analytics folks from more mature companies looking to move to an earlier-stage startup. The risk with this profile is that many late-stage analytics folks aren’t prepared for how difficult it can be to do analytics at a startup where data isn’t easily accessible, experimentation isn’t fully automated, and processes don’t exist. Their knowledge of the end state you’re building toward is helpful, but many folks end up frustrated and ultimately unhappy having to build it all themselves. To minimize this risk, I looked for folks who had worked at a startup earlier in their career and wanted to return to the earlier stage. They were more likely to understand the tradeoffs they were making. I also tried to focus on recruiting at companies that were only two or three stages ahead — for example, if you’re a Series B company, look to Series D or E companies.
- Entrepreneurs and early startup employees. This profile is less common, but if you can find an entrepreneur with the technical skills you need, they’re worth betting on. Self-starters who are resourceful and have a strong work ethic can be an invaluable asset on the team and complement the consultants and late-stage analytics folks well.
- Internal transfers. As I mentioned above, internal transfers complement more traditional analytics profiles well. I have also found that most internal transfers are successful because you can engage over a longer period and even do a “trial run” before hiring.
When the team started, we had an even mix of these profiles. For my initial hires, I wanted to find folks who complemented my finance and operations experience. I looked for people with different strengths, but a common business-focused mindset kept us grounded in our mission to drive business impact. As the team matured, I found that we were hiring more folks from later-stage companies, and now that profile makes up about a third of our team.
I still hold the same hiring philosophy at DoorDash today, and I look to hire people from a wide range of industries and backgrounds so we can learn from each other.
To build a culture where data is used to inform and accelerate decision-making, it’s critical to find the right people for your early team. Not only are these the folks who will establish the operating model for the team (how analytics partners with other teams across the company), but they’ll also set the standard for future hires. Great talent is more likely to recruit and hire other great talent.
Reorganize your team as the company’s needs evolve
Reorganizing teams to best meet the needs of the company and the team members is a normal part of a maturing organization.
Every six to 12 months, review your current structure, including organizational design, reporting structure, and how the teams work together (your operating model). Make sure that it’s meeting your current needs and will continue to work for the foreseeable future.
I may have been the person to hire our early data engineers and our first data product manager (PM), but that doesn’t mean that those folks belong on my team forever. With our data PM, it became clear once we hired a head of product and started building out the product team that our PM would benefit from the mentorship and growth opportunities of a larger product organization. After he moved teams, he maintained a close relationship with the analytics team and continued to support us. His time on the analytics team gave him an invaluable understanding of how we operated.
Over the years, roles became better defined and folks started to specialize. In my time leading analytics at DoorDash, I’ve run teams across:
- Data engineering and business intelligence (creation/curation)
- Experimentation platform (creation/curation)
- Data science and machine learning (curation/consumption)
- Data science and analytics (curation/consumption)
- Business operations, or “BizOps” (curation/consumption)
As our company matured, the analytics organization evolved, and we restructured to better meet the company’s needs.
WRAPPING UP: AN ANALYTICS READINESS CHECKLIST
An analytics team can add value at any stage by explaining what’s happening in the business, determining whether a company should take action based on current performance, and uncovering new opportunities for growth and profitability. They can help identify and quantify underlying business drivers and ensure that people work on the most impactful projects to generate real business value.
But depending on the stage of your company, the type of analytics team you need may be different.
Here are some helpful questions to help you figure out if you’re ready to hire analytics team members. If you answer any of them with “no,” it might be time to start the team.
- Do you think you’re measuring the right metrics?
- Do you have measurable goals for each area of your business?
- Do you understand the value drivers of your business — what moves the metrics you’re measuring?
- If your business performs better or worse than expected, do you understand why and how to accelerate or course-correct?
- Are you searching for new growth or profitability opportunities?
- Do you feel comfortable with how you prioritize initiatives for the greatest business impact?
- Do you understand the economics of your business and how your pricing or discounting may impact the tradeoff between growth and profitability?
- Are you using experimentation best practices to inform decision-making?
Bringing on existing folks from your company can be a good way to get started quickly. That said, if built with the right folks and purpose, I’ve never heard anyone regret starting an analytics team.